Current state
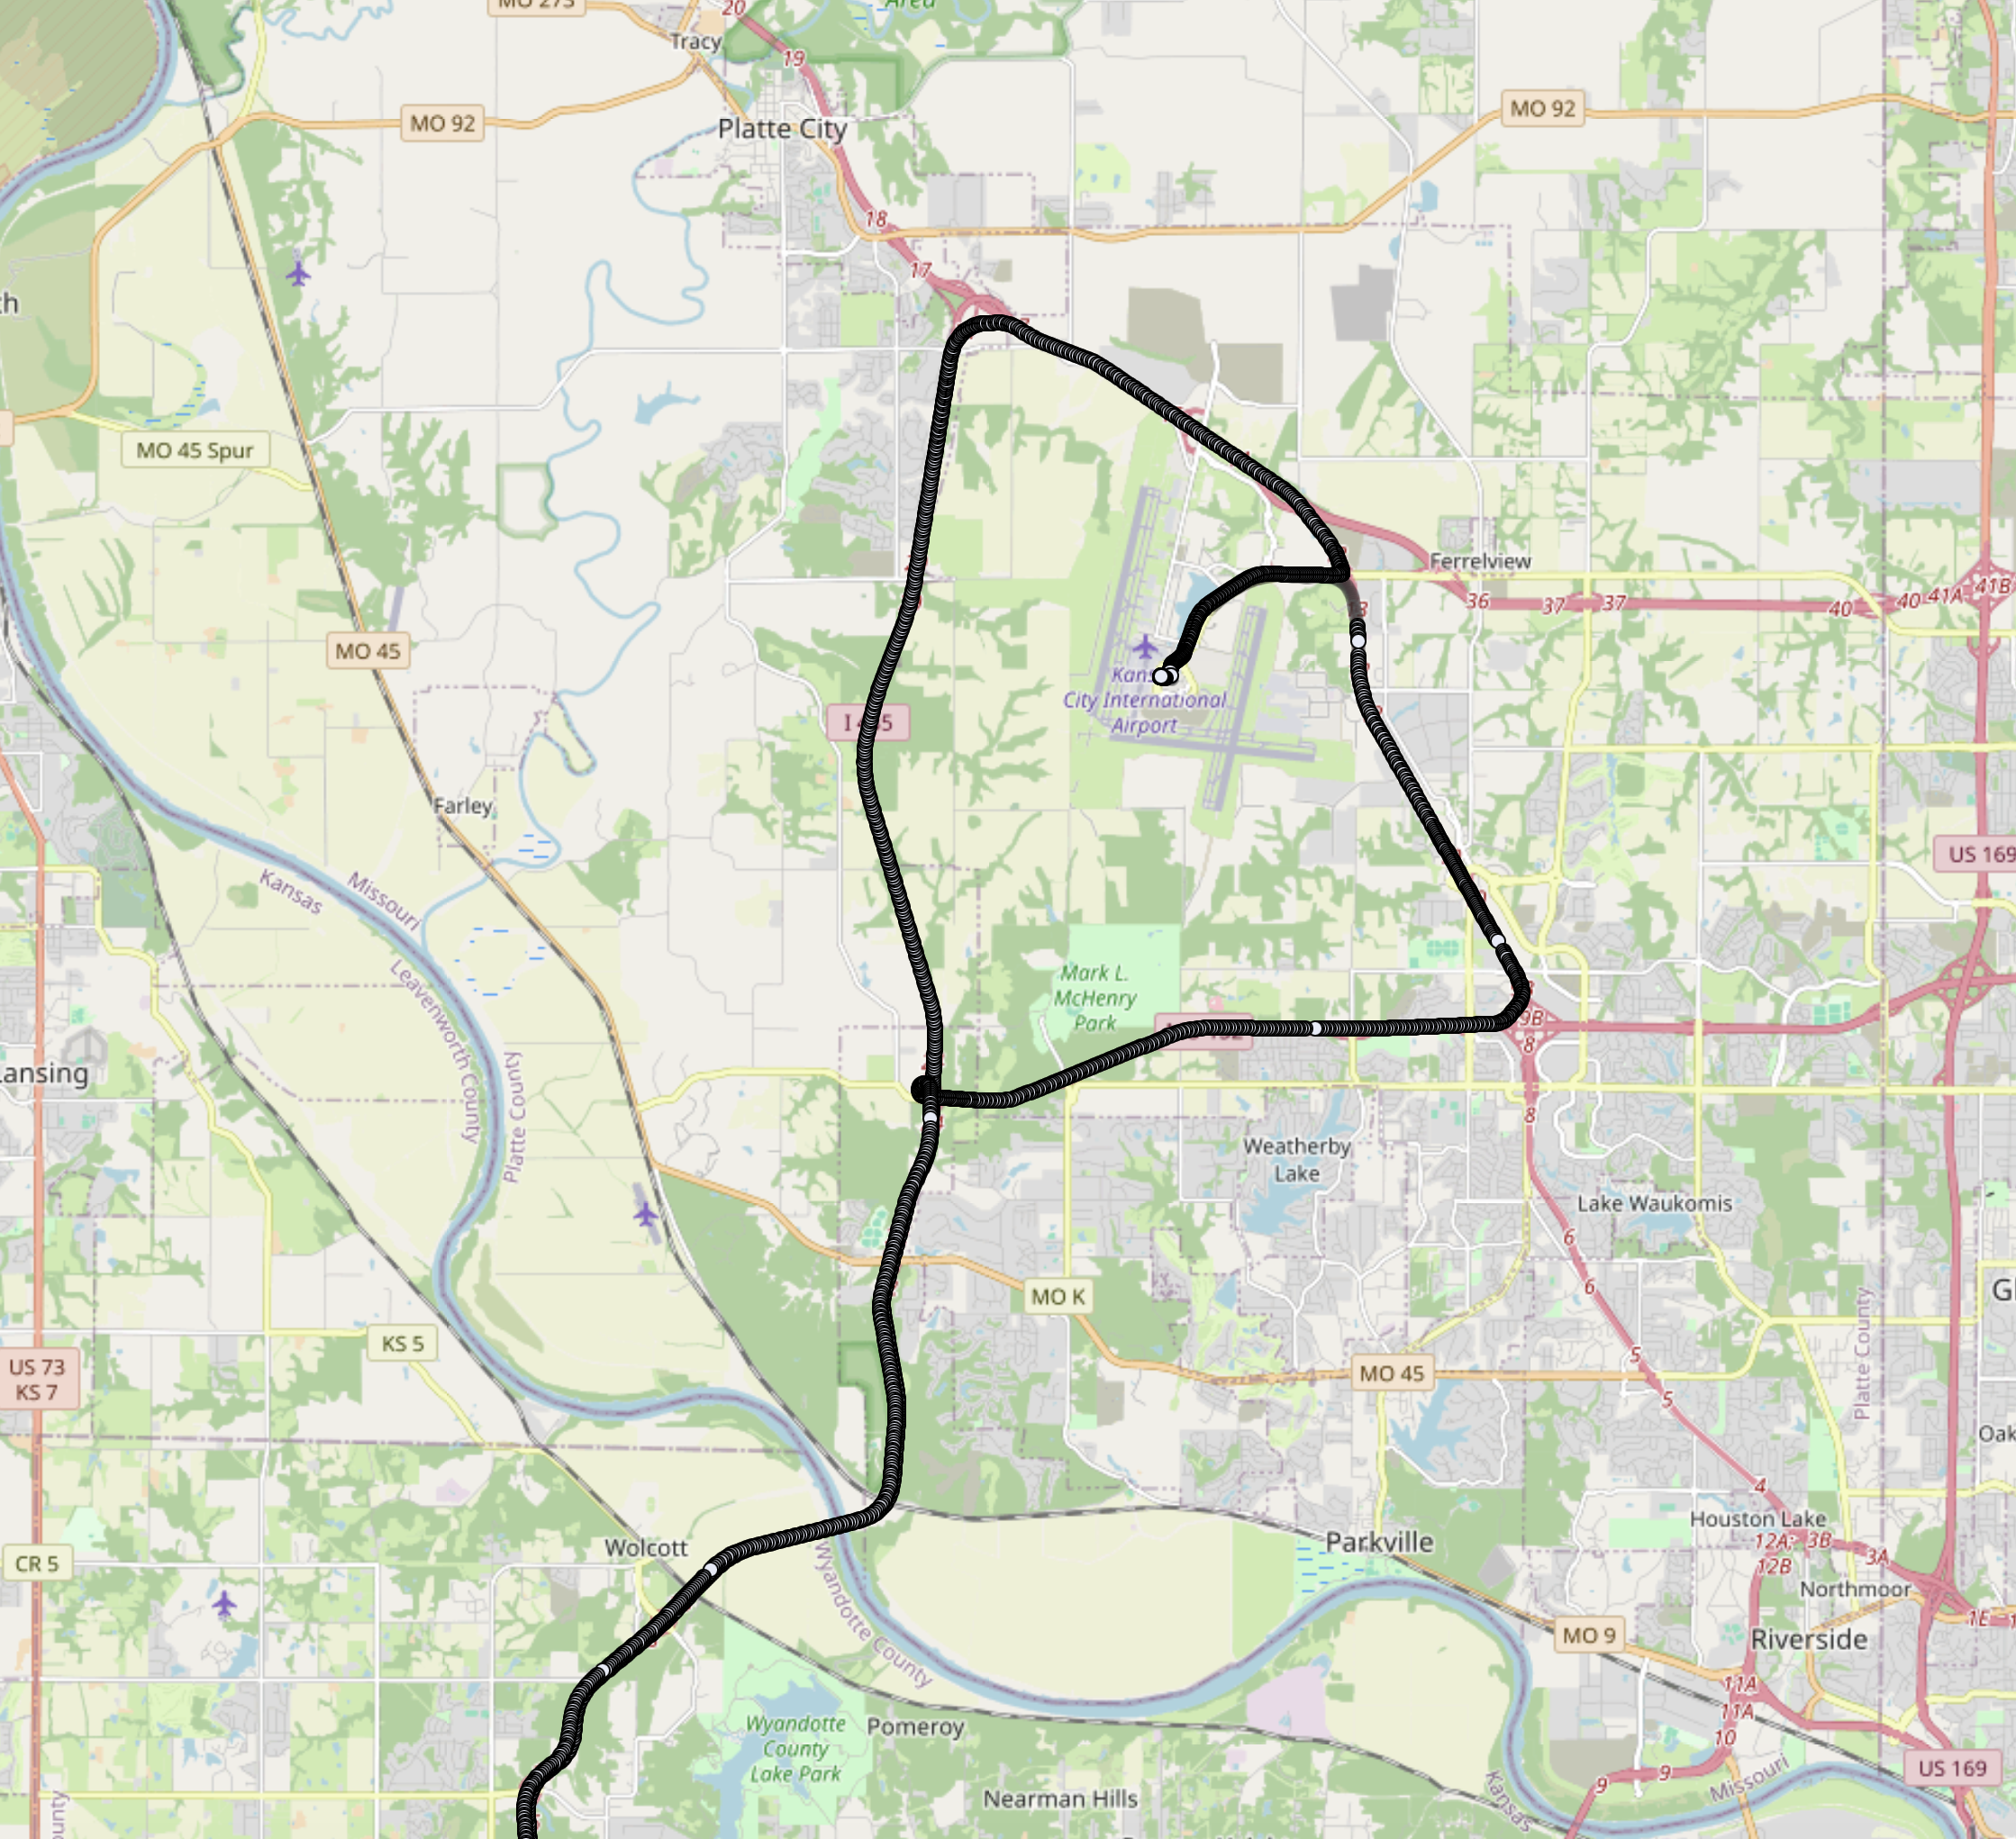
I have collected a lot more data than I am showing here, but I will avoid sharing it to avoid violating anyone's privacy.
DISCLAIMER: all of the data collected is used purely for educational pursuit. Even though logging this data is not a violation of any persons privacy I do not intend to release the data.
The dashPuppy can collect MASSIVE amounts of data. GPS position data, nearby wi-fi networks, device statistics, and once implemented, vehicle diagnostic data. To display all of this data the dashPuppy hosts a web server that can be accessed over the local network or directly via a USB-C cable as the dashPuppy can act as an Ethernet Gadget.
The map itself is rendered using OpenLayers, a library that can be far more daunting to learn than alternatives like Leaflet, but is highly customizable and can handle large datasets.
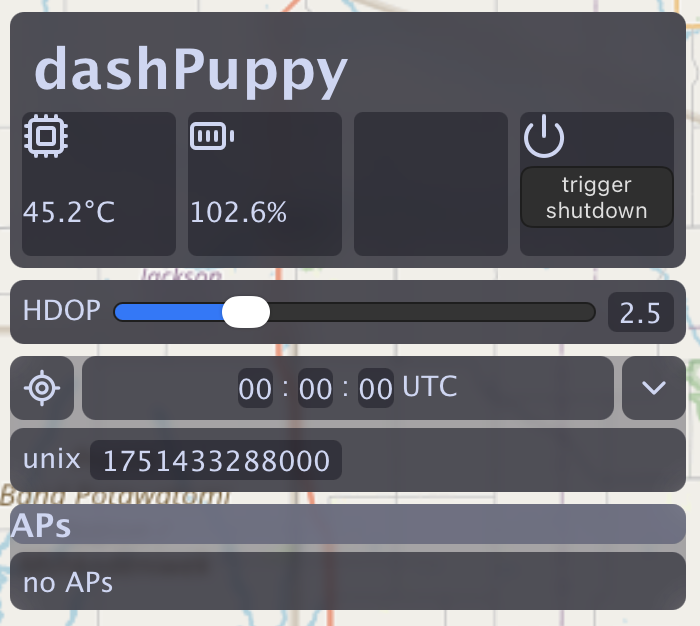
The site UI is very crude in its current state and will need reworking, but it works as a minimum viable product. The web server updates the current CPU temp and the UPS battery percentage over a websocket to that it can refresh the data frequently without a full page reload. Clicking the 'trigger shutdown' button will tell the system to perform a safe shutdown to avoid any data loss and/or corruption.
Horizontal dilution of precision (HDOP) is a measure of horizontal precision, the lower the number the higher the precision. The HDOP slider allows data points to be filtered based on this level of precision. Any points above the set threshold (higher HDOP, lower accuracy) will be rendered as transparent gray dots rather than the standard black and white dots. In general a HDOP that is around 1 is perfectly acceptable and anything higher than 5 starts to become less favorable. A poor HDOP value can be attributed to satellite geometry, an obstructed antenna, or the conditions of the atmosphere.
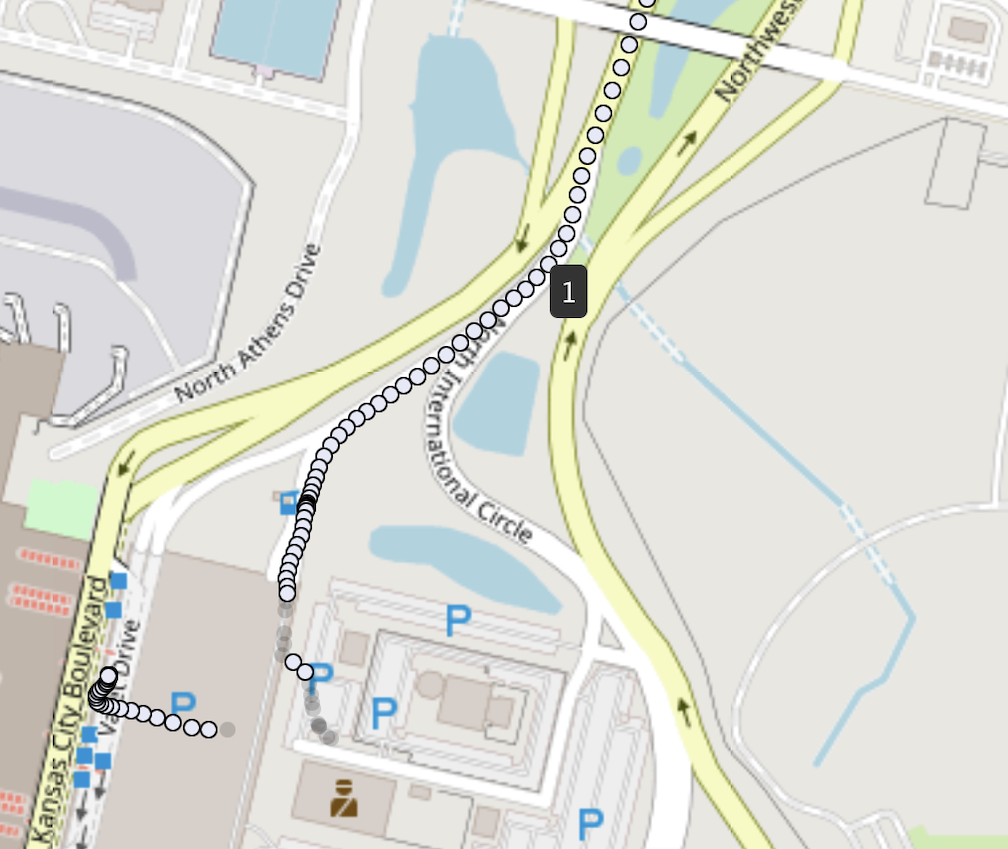
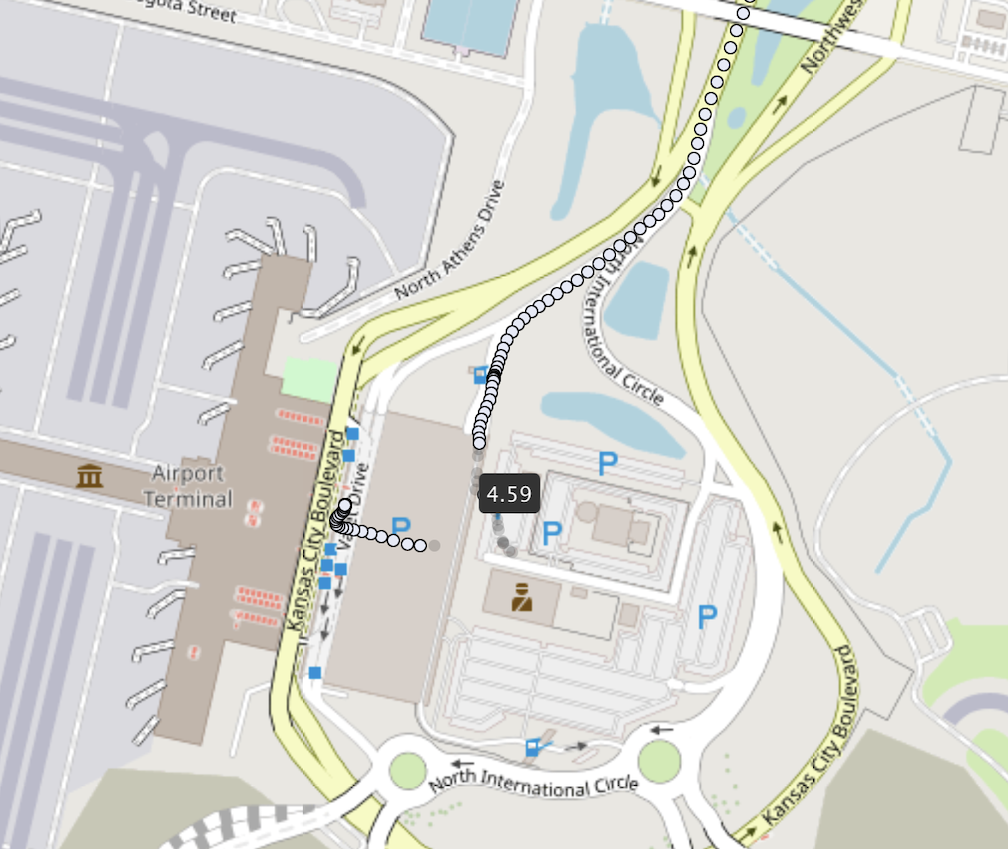
In these images we can see that hovering over a data point will show a tooltip displaying the point's HDOP, with the first image showing a 1 and the second image showing 4.59. The first data point was taken while driving on an unobstructed highway, while the second one was taken when inside the airport's parking garage. The light gray points show the position being in a restricted area, rather than the reality of driving through the parking garage. These high HDOP points can be used for decent enough approximation, but not for anything precise.
Below the HDOP slider is a panel that will display GPS information for the selected point, but as of right now it just shows the raw time code as unix time with the other fields being non functional.
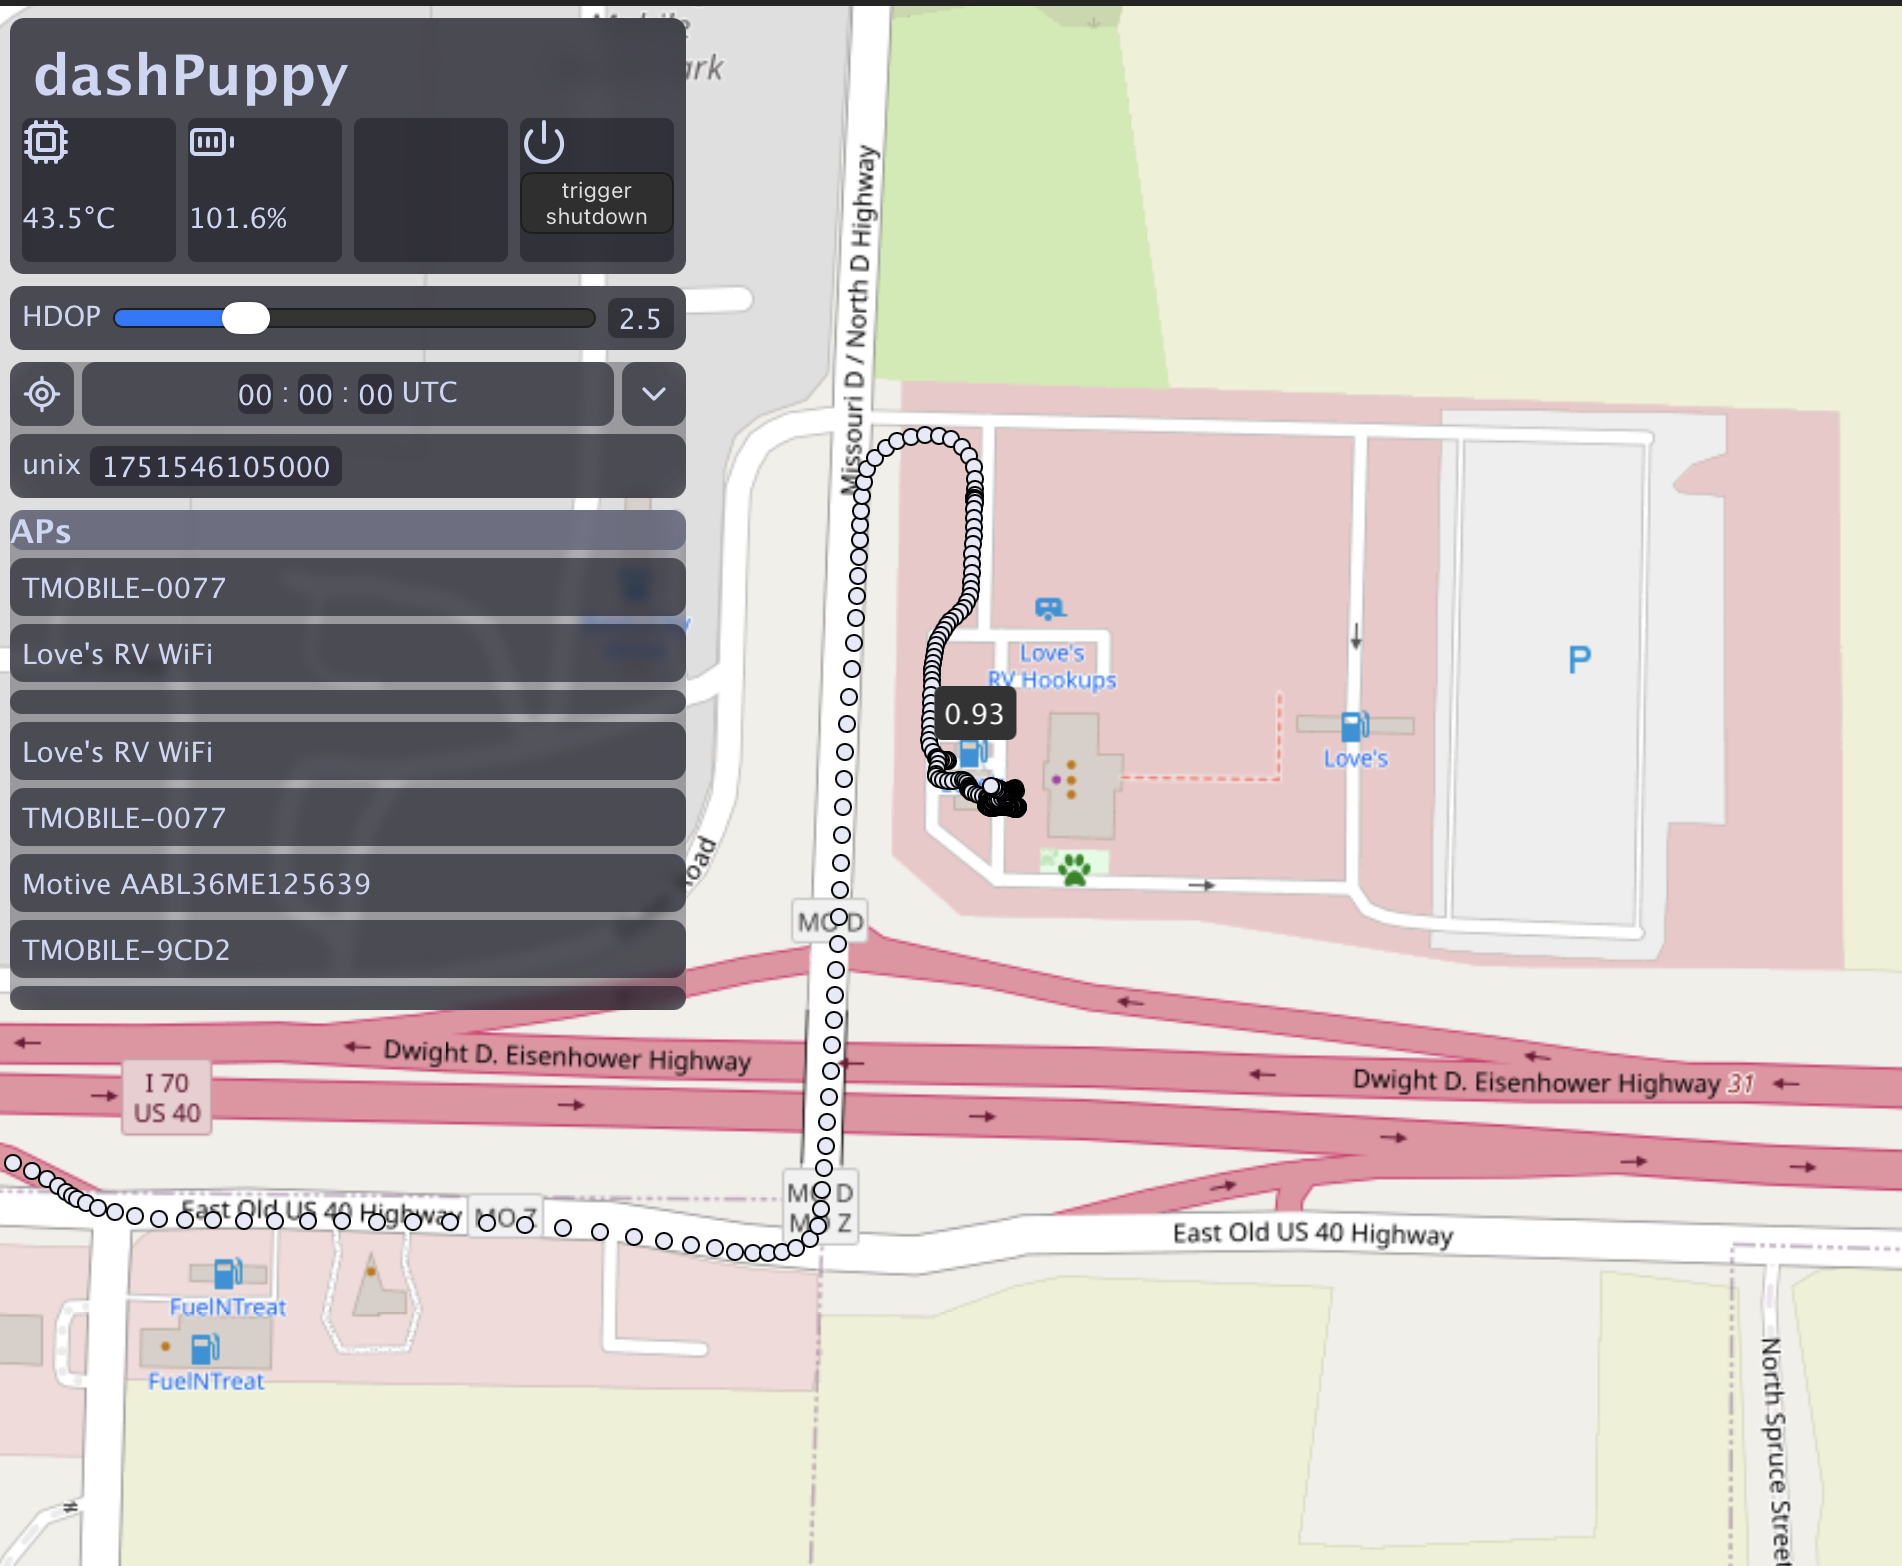
Hovering over a data point will show the HDOP with a tooltip and when clicked it is set as the viewed point on the sidebar. Whenever a point is selected the dashPuppy's database is queried to find all the access points found at that location and displays them on the sidebar below the GPS panel. As you can see here it lists the access points inside the Love's gas station as well as a few others. The access points MAC address, connection strength, and other characteristics are reordered in the database, but are not currently shown by the UI.
Next steps
The current UI gives just enough information to validate that the data is recorded and displayed correctly but it is lacking in just about every other department at the moment. Despite the rough edges this prototype validates that the dashPuppy can easily host a web server allowing monitoring and analysis as well as builds the ground work for interacting with the database.
Map Optimization
While OpenLayers is incredibly performant it struggles to keep up with the vast amount of data logged by the dashPuppy. Rather than rendering all the data points within the browsers field of view at every zoom level, it makes sense to show a heat map when zoomed out but show all the data when zoomed far enough in. As of right now the server sends all of the points at once to the browser to store in RAM, though this should be shifted to an asynchronous solution to let the browser requests the data as it needs. All of this sectioned data and heatmap data can be stored in the database once processed to avoid repeated operations.
UI rework
This was written relatively quickly without much foresight and will need to be almost entirely re-worked from the ground up, it's far from my finest work.
Data Queries
A new menu needs to be added to view and query all of the different data in the database as well as errors logged by the system. This will be especially crucial once I'm able to start communicating with my car's OBD-II port to pull diagnostic data.
Thanks for reading :)
Violet Lark
@CatKhakis
violet@larkbarks.com